/ Agricultural equipment, equipment, inventory / Agricultural equipment, inventory / Raznoe selkhozorudovanie, inventory + in assortment / FARINOGRAPH flour analyzer

Sell / buy
FARINOGRAPH flour analyzer, Dnepropetrovsk region.
Region:all of Ukraine,
Dnepropetrovsk region.
(Dnepropetrovsk, Filosofskaya street 84)
Updated:
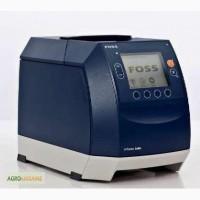
Flour analyzer PHARINOGRAPH
v Description
A flour analyzer is a device that allows you to obtain the necessary data on the baking properties of flour, as well as on the rheological properties during the dough kneading process. By means of this device, the resistance of the paddles of the mixer during kneading is determined. All received information is processed by a built-in industrial PC with its own software, recorded and displayed on the available monitor. It is possible to save charts in PDF format.
v Advantages
ü The device is easy to operate;
ü The received data is stored in your own computer;
ü An integrated computer makes connection via the Intranet possible;
ü Ability to update software via remote access;
ü The protective device located on the cover of the mixer does not allow the device to work without the cover;
ü User-friendly software in several languages;
ü Determination of rheological properties of flour.
A video review of the Farinograph flour analyzer can be viewed on YouTube at the following link: https://www.youtube.com/watch?v=_N8ecCIl0o4
v Determined indicators by the analyzer
ü Water absorption capacity (%).
This term refers to the amount of water needed or required in the middle of the graph of 500 consecutive lines;
ü Time of dough formation (min).
The time interval (in minutes) from the moment of adding the first portion of water to the formation of the dough with the maximum consistency;
ü Test stability (min).
Stability means the difference in time, expressed in minutes, between the point where the curve crosses 500 consecutive lines for the first time and the point where the curve leaves them;(//tractor-service.com)
ü Level of softening at the 10th, 12th and 20th minutes (V.U.).
The value of the 10th minute is the difference between the height of the center of the curve after 10 minutes from the moment of launch and 500 consecutive lines. The value of the 12th minute is the difference between the values at the height point of the center of the curve at the peak value and at the center of the curve 12 minutes after the peak value. The value of the 20th minute is the difference between the values at the height point of the center of the curve at the peak value and at the center of the curve 20 minutes after adding the first portion of water;
ü Flour quality coefficient.
The ratio of the mixing time to the decrease in consistency by 30 units from the point of the peak value;
ü Permissible deviation during mixing.
The difference in values between the upper point of the curve at maximum consistency and the point of the curve corresponding to 5 min. after the point of maximum consistency.
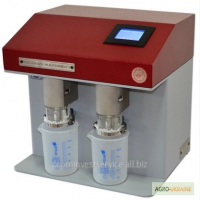
FARINOGRAPH with automatic dosing system
v Description
The device is used to determine a wide range of data on the kneading and baking properties of flour. The resistance of the dough to the mixing paddles at the time of kneading depends on the quality of the flour, and the properties of the flour are determined during this period of dough kneading. The device is equipped with a built-in industrial PC and software, controlled directly through the touch screen. The available water dosing system is also controlled using a touch screen. All the characteristics of the test are measured, calculated and entered into the device's PC. The results are displayed on the screen. The graph is saved on the computer in PDF format.
v Advantages
ü Easy to use, has a reliable design;
ü The system of automatic water dosing is controlled by means of a computer;
ü Saving data and results in a PC;
ü The presence of an integrated computer that makes it possible to connect to the Internet;
ü Effortless software update using remote access;
ü Safety device on the lid of the mixer;
ü Accuracy of water dosing
ü User-friendly multilingual software;
ü Determination of the rheological properties of flour.
v Description
A flour analyzer is a device that allows you to obtain the necessary data on the baking properties of flour, as well as on the rheological properties during the dough kneading process. By means of this device, the resistance of the paddles of the mixer during kneading is determined. All received information is processed by a built-in industrial PC with its own software, recorded and displayed on the available monitor. It is possible to save charts in PDF format.
v Advantages
ü The device is easy to operate;
ü The received data is stored in your own computer;
ü An integrated computer makes connection via the Intranet possible;
ü Ability to update software via remote access;
ü The protective device located on the cover of the mixer does not allow the device to work without the cover;
ü User-friendly software in several languages;
ü Determination of rheological properties of flour.
A video review of the Farinograph flour analyzer can be viewed on YouTube at the following link: https://www.youtube.com/watch?v=_N8ecCIl0o4
v Determined indicators by the analyzer
ü Water absorption capacity (%).
This term refers to the amount of water needed or required in the middle of the graph of 500 consecutive lines;
ü Time of dough formation (min).
The time interval (in minutes) from the moment of adding the first portion of water to the formation of the dough with the maximum consistency;
ü Test stability (min).
Stability means the difference in time, expressed in minutes, between the point where the curve crosses 500 consecutive lines for the first time and the point where the curve leaves them;(//tractor-service.com)
ü Level of softening at the 10th, 12th and 20th minutes (V.U.).
The value of the 10th minute is the difference between the height of the center of the curve after 10 minutes from the moment of launch and 500 consecutive lines. The value of the 12th minute is the difference between the values at the height point of the center of the curve at the peak value and at the center of the curve 12 minutes after the peak value. The value of the 20th minute is the difference between the values at the height point of the center of the curve at the peak value and at the center of the curve 20 minutes after adding the first portion of water;
ü Flour quality coefficient.
The ratio of the mixing time to the decrease in consistency by 30 units from the point of the peak value;
ü Permissible deviation during mixing.
The difference in values between the upper point of the curve at maximum consistency and the point of the curve corresponding to 5 min. after the point of maximum consistency.
FARINOGRAPH with automatic dosing system
v Description
The device is used to determine a wide range of data on the kneading and baking properties of flour. The resistance of the dough to the mixing paddles at the time of kneading depends on the quality of the flour, and the properties of the flour are determined during this period of dough kneading. The device is equipped with a built-in industrial PC and software, controlled directly through the touch screen. The available water dosing system is also controlled using a touch screen. All the characteristics of the test are measured, calculated and entered into the device's PC. The results are displayed on the screen. The graph is saved on the computer in PDF format.
v Advantages
ü Easy to use, has a reliable design;
ü The system of automatic water dosing is controlled by means of a computer;
ü Saving data and results in a PC;
ü The presence of an integrated computer that makes it possible to connect to the Internet;
ü Effortless software update using remote access;
ü Safety device on the lid of the mixer;
ü Accuracy of water dosing
ü User-friendly multilingual software;
ü Determination of the rheological properties of flour.
|
Shop, contacts | |
LLC NPO PromInvestService/ optzyvy, info. | |
|
Phone:
+38-xxxxxx
show
| |
| http://pis.com.ua/ | |
All user ads ~36 | |
Ad ID: #640441
(added by a registered user)
Added/Updated: 09-22-2026 09:24 (current, until: 22-09-2027)
Permanent ad address:
Showed / watched for today: ?, total: ?
Similar ads



All Ukraine: Agricultural equipment, equipment, inventory 45618 / Agricultural equipment, inventory 1553 / Raznoe selkhozoborudovanie, inventory + in assortment 289
Dnepropetrovsk region: Agricultural equipment, equipment, inventory 8763 / Agricultural equipment, inventory 134 / Various agricultural equipment, inventory + in assortment 37